Overview
What a blast November was! A perceived monetary policy “pivot” from the Federal Reserve (FED) triggered a bond rally. This in turn pushed equities up sharply, on a worldwide basis.
The S&P’s 500 gained 9.13% in November. The Nasdaq Composite rose 10.83% while the Russell 2000 (Small Cap Stocks.) advanced 9.05%. In international markets, the EPAC BM Index of developed economies (ex-US) rose 9.56% and the MSCI EM (Emerging markets) 7.86%.
The belief that the FED is done with its interest tightening cycle and that it is likely to reverse policy in 2024 led to a bond rally, as illustrated below:
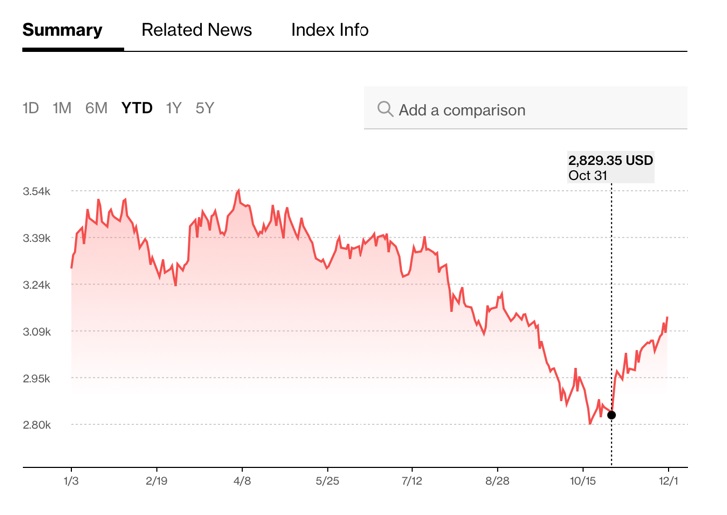
The graph illustrates the price behavior of the long-term US Government bond this year. The vertical line marks the end of October. In November, the price of these bonds shot up 9.16% (to the right of the vertical line).
Elsewhere in fixed income, the US Aggregate rose 4.53%, the Bloomberg Corporate bond index was 5.98% up and the municipal sector was up a powerful 6.35%.
In November, our median portfolio rose 6.97%. Over the same period, a portfolio consisting of 50% ACWI (All Country World Index) and 50% AGG (US Bond Aggregate) rose 6.71%. As of November 30, our median account was up 9.91% in 2023 vs. 9.28% for our benchmark.
Market developments
During the month of November, investors’ belief that the fight against inflation was almost won and that the US economy was still not showing signs of recession combined to propel both bonds and equities sharply up.
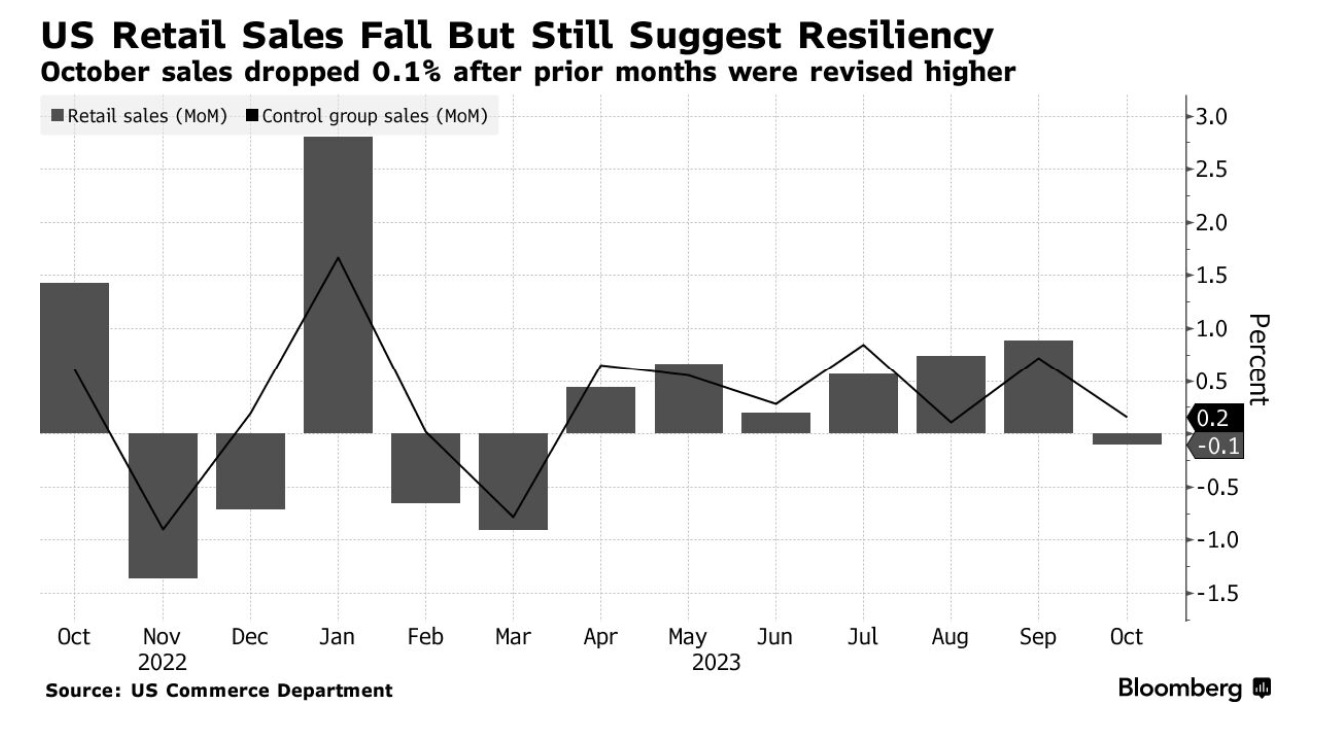
It all started with the FED’s Chairman intimating that the tightening cycle might be over. That’s all that was needed for bonds and equities to rally sharply in the first days of November. The “risk-on” mood was reinforced by weakening consumer confidence numbers published on the 10th of the month, good inflation data on the 14th and relatively subdued retail sales data shortly after, as shown below:
Investors have been betting that the FED is done with its tightening cycle, that it will reverse course sometimes in the second part of 2024 AND that the US economy will not suffer from more than a shallow recession. That’s a lot to expect!
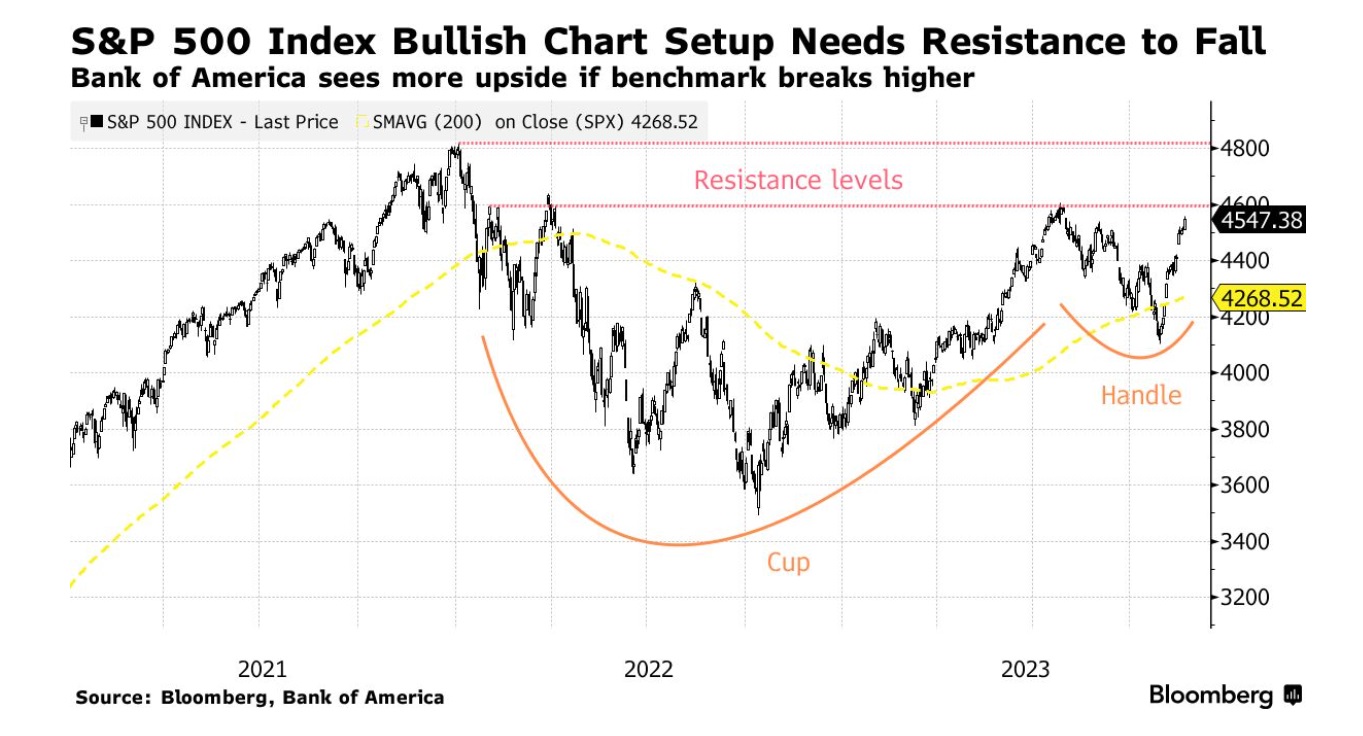
So far so good. However, technical indicators are at a critical juncture, as illustrated in the graph of the S&Ps’ 500, below:
Portfolio Commentary
In November, our portfolios did generally better than their benchmark. Schwab performed particularly well (SCHW). The stock was up 18% this past month. I bought a few of their shares for those accounts that were not yet fully allocated.
As interest rates drop, Schwab’s cost of funding falls and their bond holdings are re-revaluated upward. The stock has further to go.
Elsewhere, as US Treasury bills were maturing, I started buying AGG. I h ave not done so systematically yet. The volatility in the bond market volatility remains high. However, should the decline in long-term interest rates continue, I would increase our exposure to AGG to participate more fully to the improved bond market conditions.
Below is the chart for AGG:
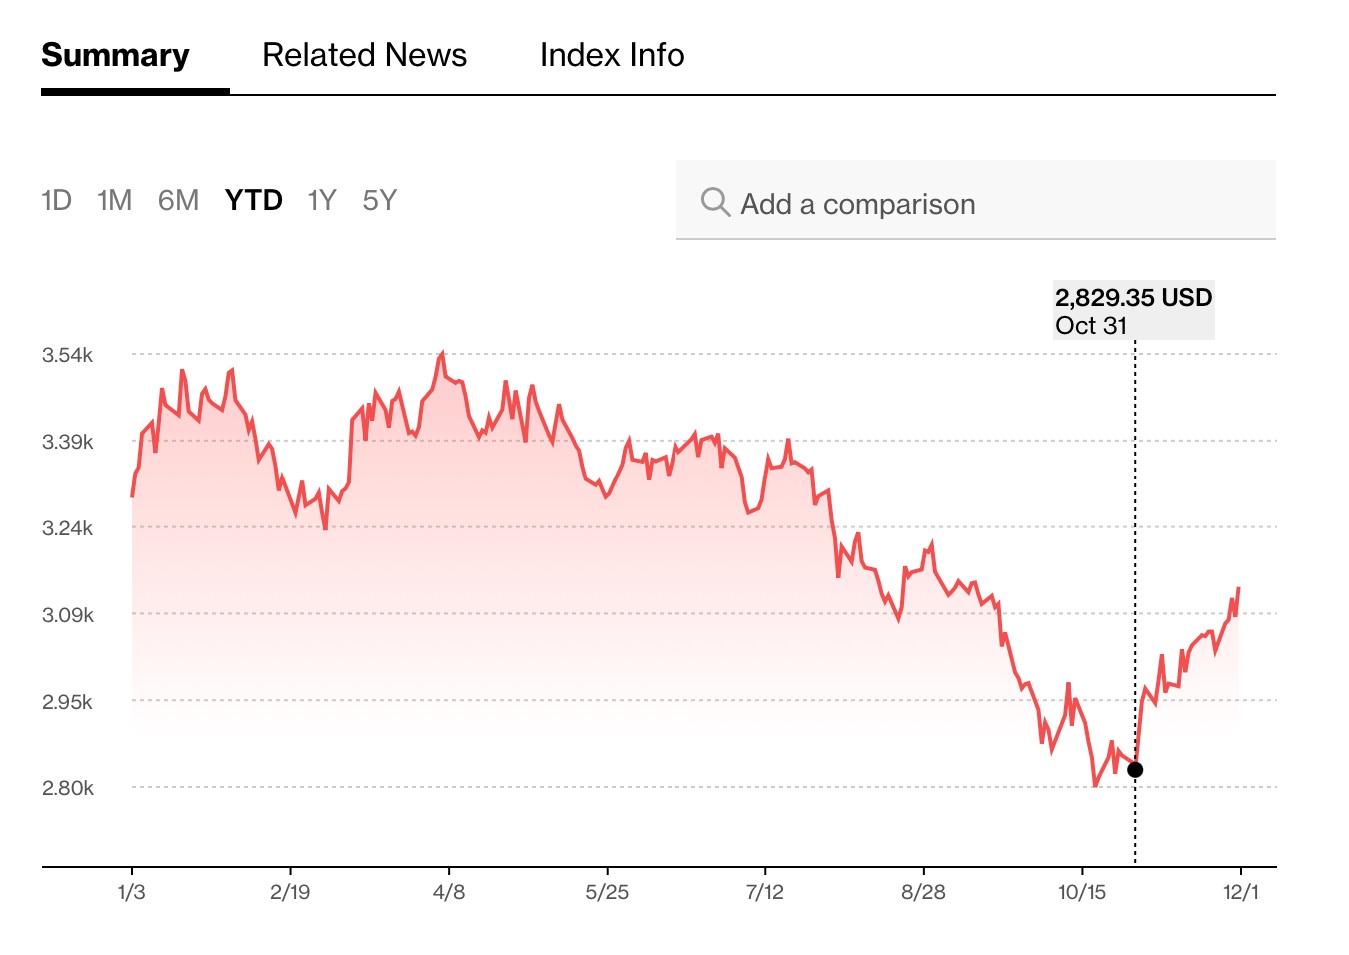
This chart resembles a lot the one on the first page of this letter. However, unlike the first one, it summarizes the performance of the totality of the US bond market YTD and not just that of the long bond.
Conclusion
The sharp November move-up in equity and bond prices was an exceptional event. It is unlikely to repeat itself soon. As is often the case after sharp moves of this type, consolidation might ensue. We might see a bit of that in December.
Alternatively, if the unemployment and inflation numbers for the month of November, published respectively at the end of this week and next, confirm the current trends, our portfolios might gain another one or two percentage points before year-end. I expect that much.
Thank you for your continued trust.
Jeff de Valdivia, CFA, CFP
Fleurus Investment Advisory, LLC
www.fleurus-ia.com
(203) 919-4980