
Overview
Equities markets reversed in August, under pressure from an anticipation of more interest rate tightening in the US and elsewhere. The S&P’s 500 lost 4.08%. The Nasdaq Composite dropped 4.53% while the Russell 2000 (Small Cap Index) managed to reduce its losses to 2.05%.
Internationally, performances were generally in line with US markets. The EPAC BM Index of developed economies dropped 4.69% but emerging markets eked small gains with the MSCI (EM) up .42%. The good relative performance of this sector was a bit surprising given the relentless advance of the USD during the month. In August, the USD rose another 2.76% against other major currencies. It is up 14.57% this year as measured by the DXY index. In a repeat of conditions that prevailed at the beginning of the year, the bond market followed equities in their downward trajectory. US Corporate bonds fell 2.93% overall. The US long-bond dropped 4.43% while the high yield sector eased only by 2.26% (Bloomberg US High Yield Index).
The chart below illustrates the sharp market reversal that started around August 16 and the acceleration of the downward movement around the time of the Fed chairman’s Jackson Hole address.
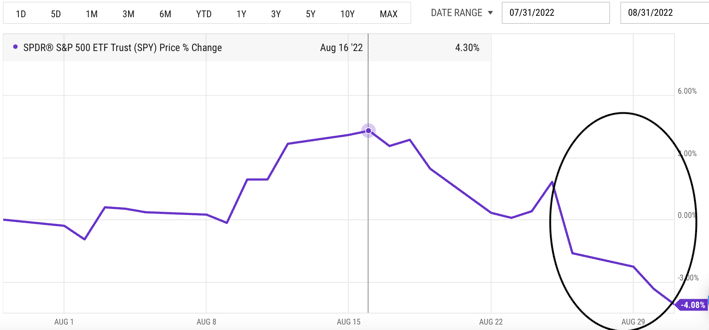
On August 16, the S&P’s 500 was up more than 4% for the month. It completly reversed itself as more hawkish talk started coming from members of the Federal Reserve Board, in anticipation of the Jackson Hole address. When Jerome Powell confirmed in his August 27 speech than the Fed was not ready to loosen the monetary reins, markets took a dive (oval to the right).
In August, our median portfolio lost 2.64%. Over the same period, a portfolio consisting of 50% ACWI (All Country World Index) and 50% AGG (US Bond Aggregate) declined 3.70%. On a YTD basis, our median portfolio has lost 17.45% vs. 14.65% for our index. As a reminder, the equity allocation in our clients’ portfolios varies currently from 35% to 70%, depending on risk profile.
Market developments
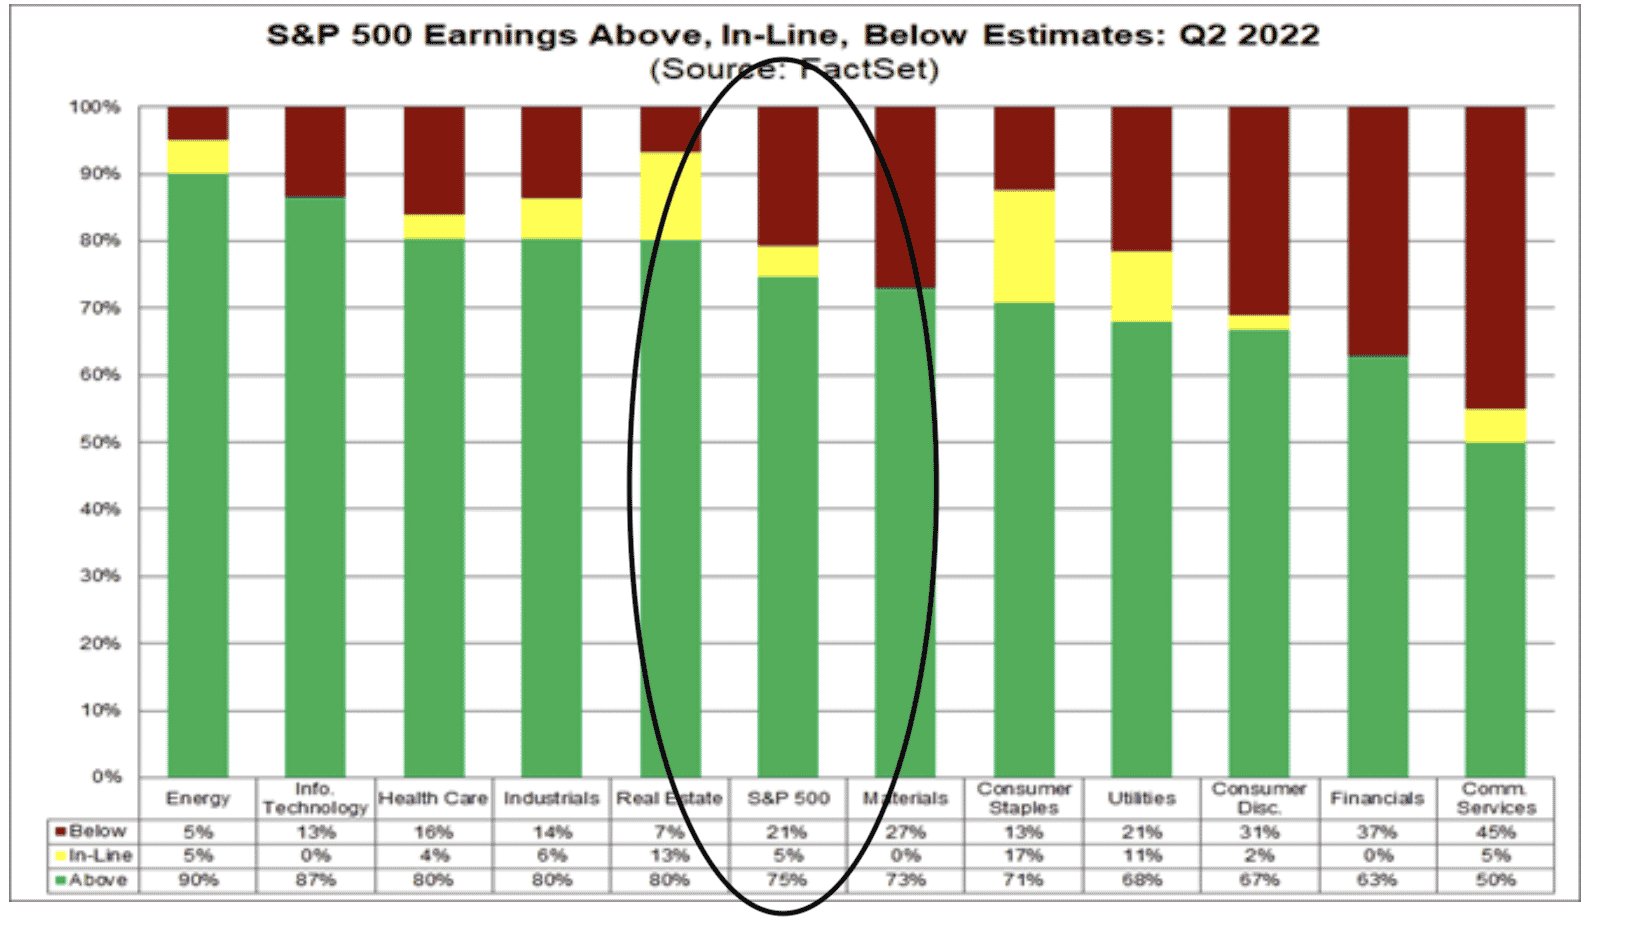
The month of August started with surprisingly good unemployment data. Payrolls increased well above expectations. Shortly thereafter, the CPI for July came in a little below expectations and consumer confidence surveys appeared to confirm that the US consumer remains willing to spend. Finally, second quarter corporate earnings continued to meet expectations (see chart below).
Taken together, these good metrics contributed to pushing equity indices up 4% by August 15.
Then, in a case where good (economic) news is bad for equity markets, equities started taking a downward turn. The story line was something like this: “if the economy is too strong, the chances that the Federal Reserve Board will slow down the pace at which it raises interest rates will drop, pushing the Fed’s pivot (the time when it stops raising interest rates) that much farther in the future”.
This line of thought was reinforced when several Fed governors subsequently confirmed their support for continuing the monetary tightening cycle (raising interest rates) until inflation is clearly tamed.
Then on August 27, the Federal Reserve Board’s Chairman, Jerome Powell, exacerbated the downward movement in equities by delivering a more hawkish speech than anticipated at the Jackson Hole gathering of central bank senior officials. Equities went down a further 4% in the waning days of the month.
Markets are still adjusting.
Tilts and Allocations
In August, I continued to substitute our investment in SPY and related US equities for VTV, the US equity value ETF. This allows us to maintain exposure to equities but with a concentration on companies with sturdier earnings and in economic sectors that are less sensitive to the economic cycle and to tightening interest rates. This has proven beneficial so far. VTV dropped 2.68% in August vs. 4.08% for SPY.
Our portfolio benefitted from a reversal (finally) in the fortunes of Goodyear Tires (GT). Their second quarter earnings surprised markets positively. GT ended up the month of August up 14%. In combination, our investment in VTV and remaining positions in GT allowed us to outperform our benchmark nicely.
From a technical standpoint, equities may be on the cusp of stabilization or of a small rebound based on the technical chart below:
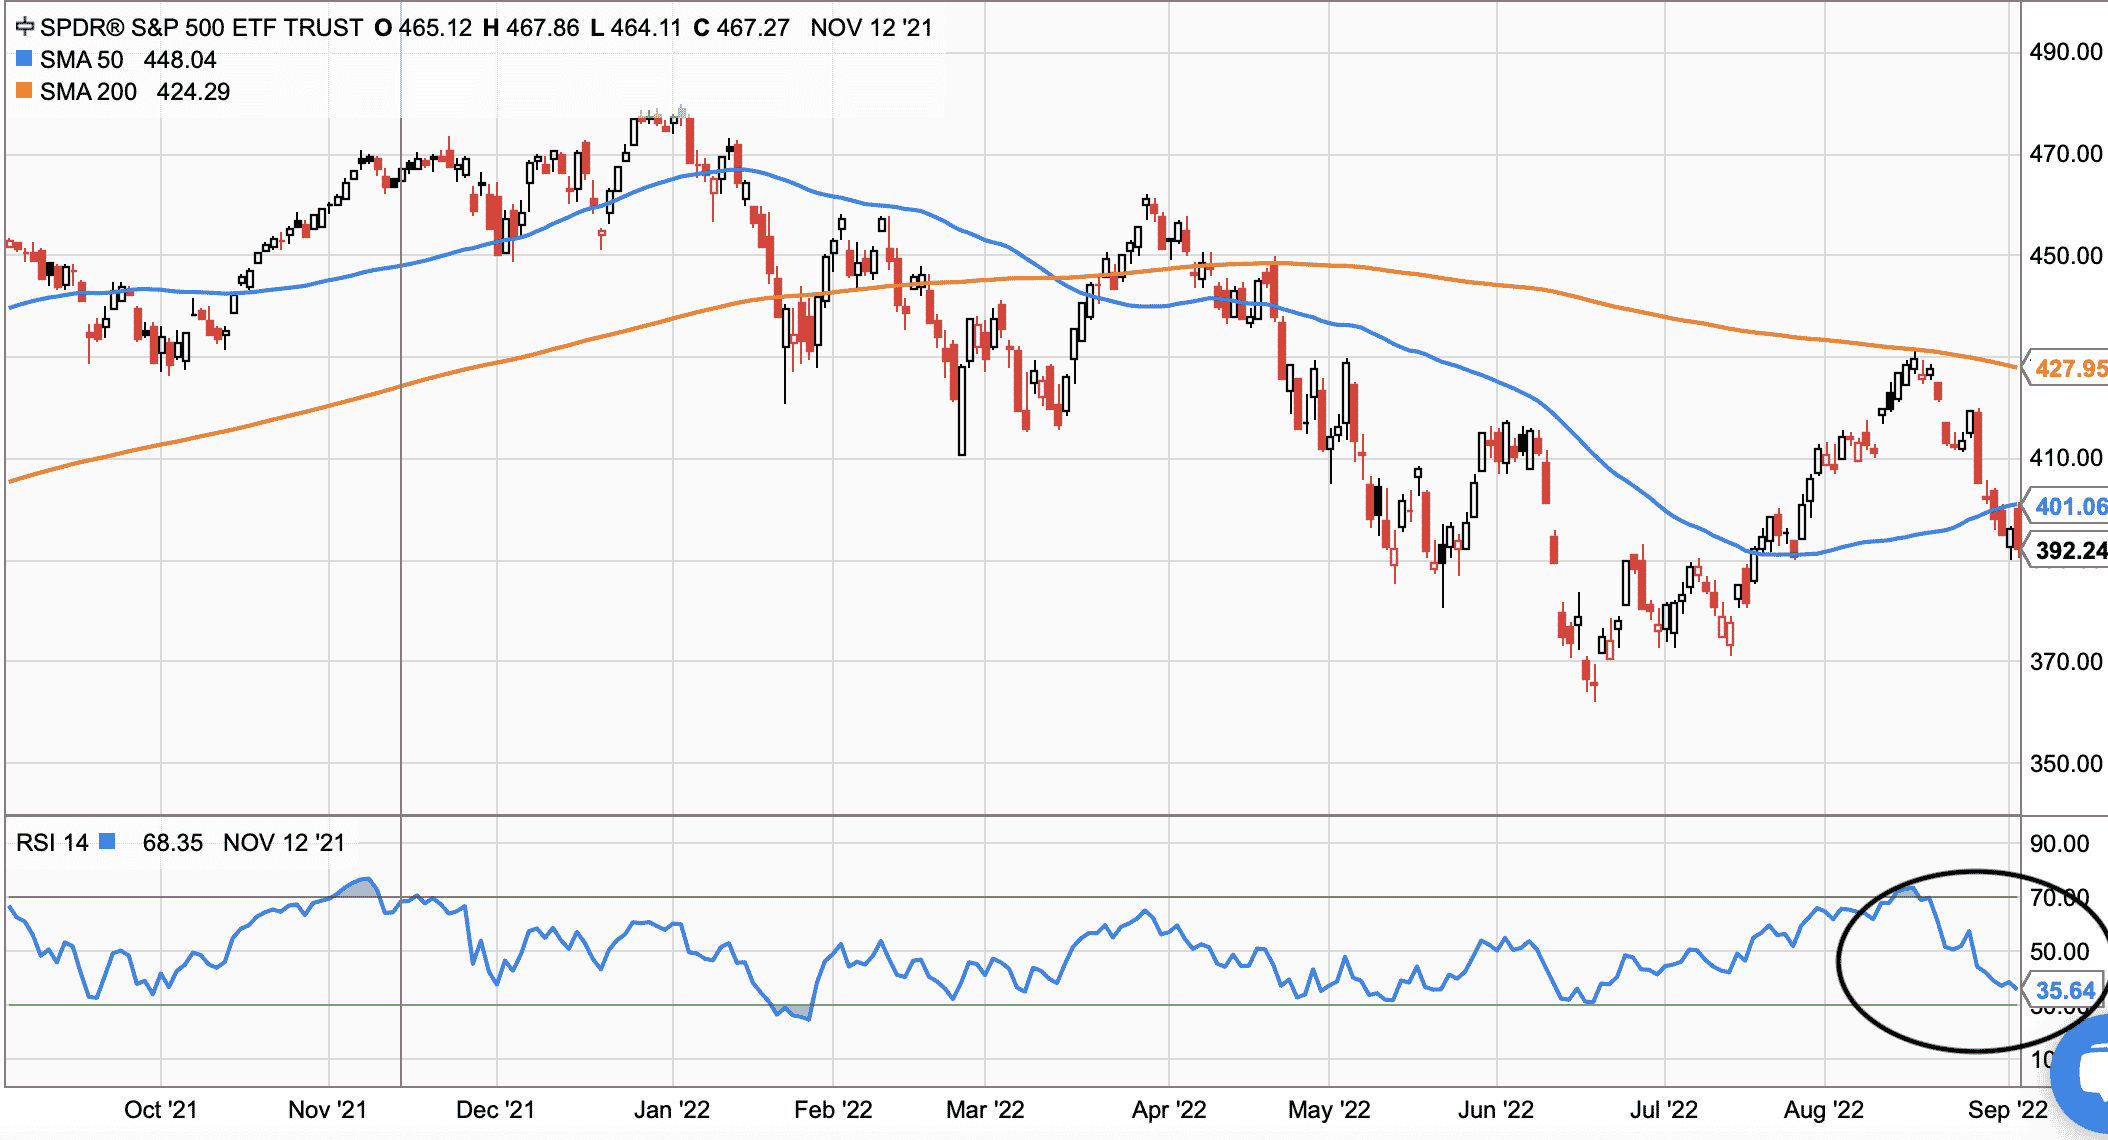
The chart represents the performance of SPY over the past year. The mid-July/mid-August rebound is clearly visible to the right of the main quadrant. So is the slide downward since mid-August. The chart in the lower part of the picture (blue line) represents a relative (market) strength indicator (RSI). That indicator tends to fluctuate between the green and red horizontal lines. When the blue line is close to the green horizontal line, equities tend to pop up. After the August downdraft, we are close to such a point.
Conclusion
The US economy remains in good shape in a world where geopolitical factors contribute to pushing Europe towards a recession and where China’s economy is clearly hampered by successive anti-Covid disruptions.
How long can the US economy maintain positive momentum in this global environment AND with a tightening monetary policy stance? Not long. A slowdown appears inevitable. Its severity may be in question but not the likelihood of its occurrence.
In this already difficult context, new inflation data in September and third quarter corporate earnings in October will play a key role in deciding how markets fare over the remainder of the year. Prudence remains “de rigueur”.
Please feel free to reach out to me with any questions. Thank you for your continued trust.
Jeff de Valdivia, CFA, CFP
Fleurus Investment Advisory, LLC
www.fleurus-ia.com
(203) 919-4980