Overview
In July, the S&P 500 positive momentum continued, pushing up monthly performance another 2.24% overall while the Nasdaq composite rose 3.72% and the Russell 2000 (Small Cap stocks) gained a comparatively meager 1.73%.
Internationally, the situation was quite different. The EPAC BM Index of developed economies (ex-US) lost .08% while emerging markets progressed in line with US indices. The MSCI EM (emerging markets) rose 2.02% and the MSCI Frontier 100 index added 4.41%.
A resilient US economy (or so it appeared during most of the month of July), coupled to tariff negotiations largely settled in favor of the US, combined to push US indices up. That also led to a sharp reversal in the trajectory of the USD.
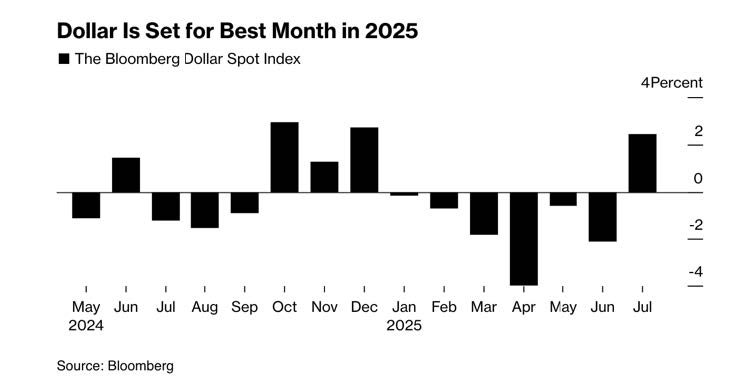
Contrary to what had happened in 2025 until two weeks ago, the USD gained a whopping 3% in July overall, causing international equities to tumble, with the exception of emerging markets. Those markets were sustained by an increase in oil prices.
Below is a chart of the monthly performances of the USD this year, against a basket of key currencies:
US fixed income markets were largely stable in July. The US bond aggregate was down .26% but investment grade and high yield corporate bonds eked out small performances of .07% and .45% respectively.
Our median portfolio was down .28% in July. Over the same period, a portfolio consisting of 50% ACWI (All Country World Index) and 50% AGG (US Bond Aggregate) rose .40%. Year to Date (YTD) our median portfolio is up 3.92% vs. 7.61% for our benchmark.
Market developments
For most of July, the dominant narrative that led US equities upwards continued to be articulated around three themes:
- The US economy appears to be stronger than originally expected,
- Inflation, if stubborn, remains moderate,
- Tariffs will settle eventually at acceptable levels.
GDP numbers for the second quarter seemed to support these themes, as shown below:
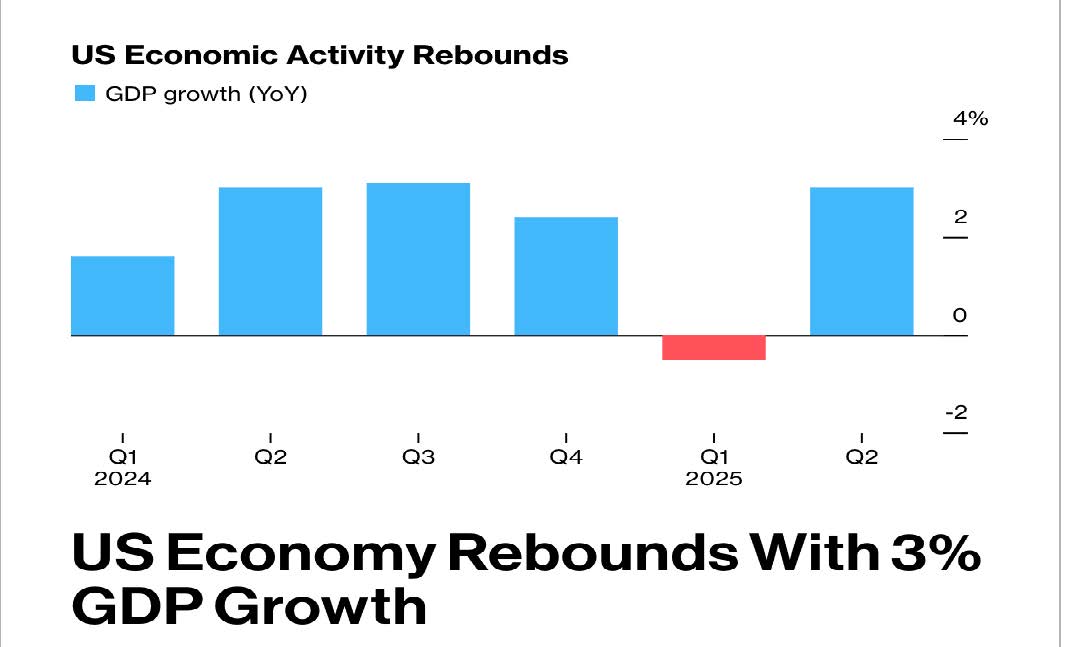
What was less apparent in this significant rebound was the part played by the US consumer (lower than expected) and that of international trades (large than expected). What caused the bounce in the US GDP in the second quarter is an inventory build-up by US industry as it tried to beat impending tariffs. In other words, what caused the sharp drop in the first quarter data (delaying of purchases until tariffs were settled) was reversed in the second (acceleration of purchases because we don’t know where these negotiations will go). Overall, the US economy may not be in that great a shape after all.
However, it took economic data released on the last day of July (US PCE inflation) and the first day of August (Unemployment for July) to make that more explicit.
The first fissures in the “all is well” picture clearly appeared in the unemployment numbers released on August 1st. Those numbers showed that very few jobs have been created over the past few months. A lot fewer than initially reported. Whether this is an indication of an impending economic slowdown appears to be a viewpoint that is gaining in credibility.
Portfolio Commentary
In July, our portfolios suffered from the sharp reversal of the USD, particularly against the currencies (€,Y) of our key trading partners.
Our international developed market equities went down close to 2% (IEFA) and Air Liquide lost close to 5% due to tariffs negotiations settling mostly in favor of the US vs. the EU and with a USD gaining 3%, as previously mentioned.
Additionally, the continuation of an investment narrative centered on US exceptionalism reinforced by a faster growing US economy and its dominance of AI, pushed the tech sector up sharply up, in spite of stretched valuations, as shown below:
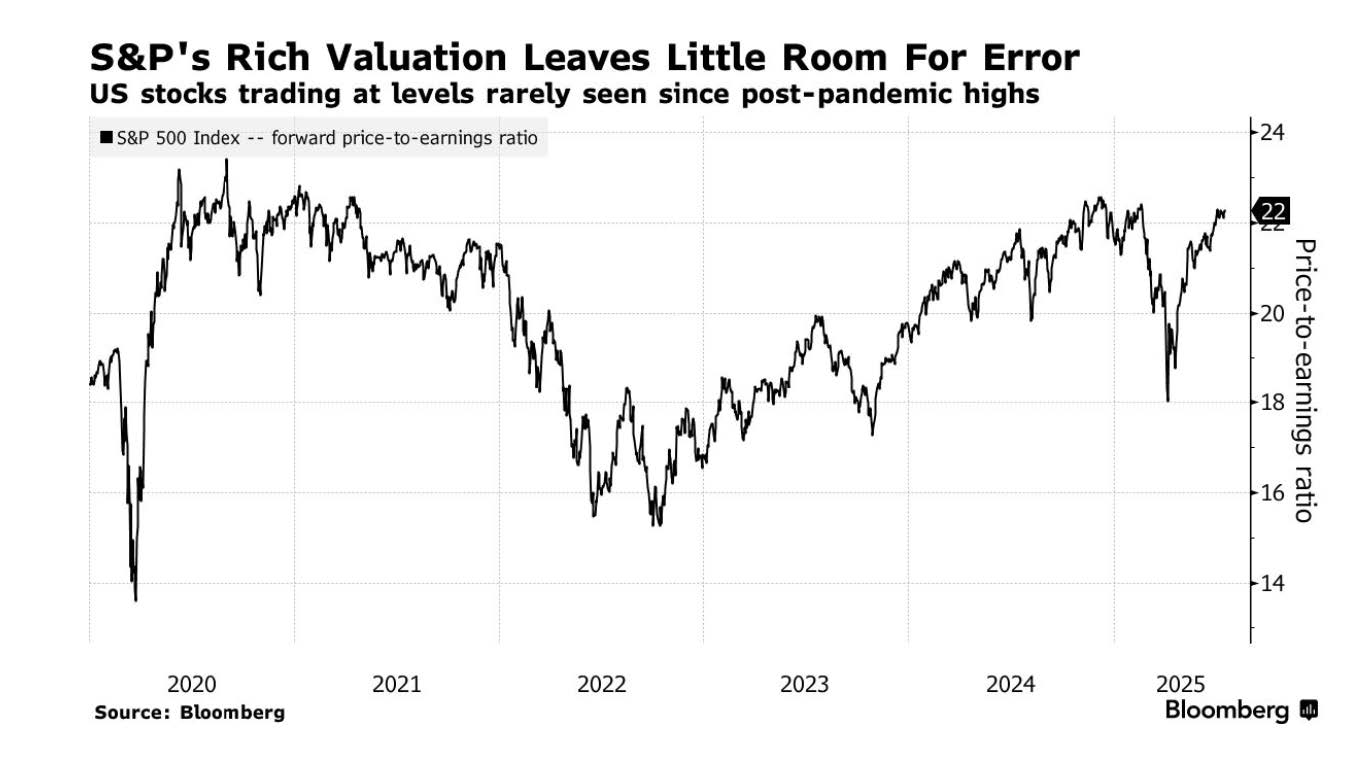
As a consequence, our US equity investments in RSP (the S&Ps’ 500 equal weight ETF) and VTV (an ETF focused on “Value” equities) suffered, in relative terms, compared to a fully “tech-laden” index like the S&Ps’ 500 or the Nasdaq 100.
Since early May, I have mostly resisted the impulse of investing in those “tech-laden” indices.
This is because I do not believe that the US economy is as resilient as economic numbers throughout the year have led us to believe. If my belief is confirmed, these are the indices that will suffer the most in a market reversal.
Conclusion
The economic situation remains volatile and confusing.
On the one hand, corporate earnings for the second quarter have so far been “market-supportive” and better than expected. Specifically, with 25% of S&P 500 firms reporting as of this writing, 82% have beaten (lowered) earnings expectations.
On the other hand, the US consumer is showing serious signs of fatigue, inflation is stubbornly high, and tariffs have not yet bitten us.
The chart below shows the effect of tariffs on revenue collections by the Federal government.
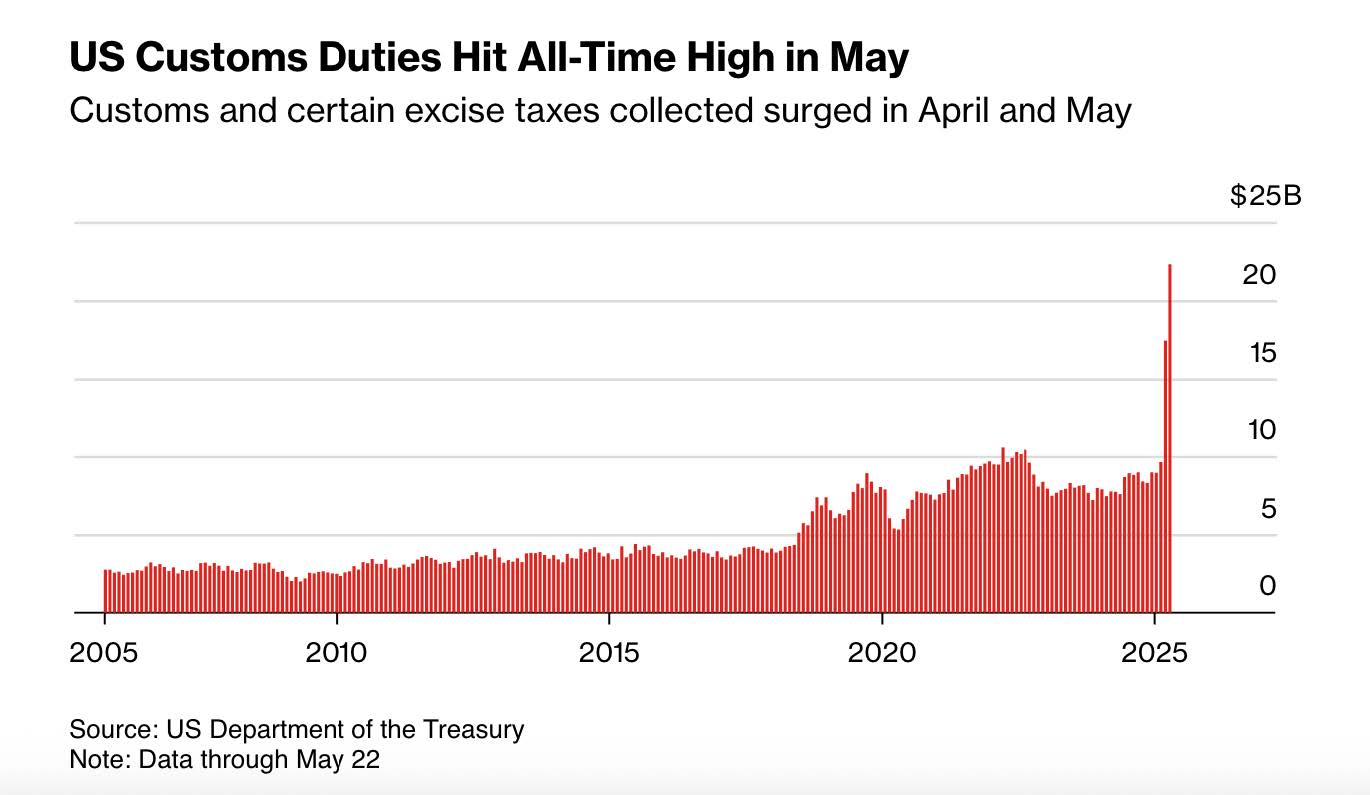
On the other side of this huge increase are likely price increases for US consumers. Corporations will not absorb those cost, or only a tiny portion of them. This is bound to have a negative effect on the economy. With that in mind, redeploying cash to equities now seems relatively premature.
Thank you for your continued trust.
Jeff de Valdivia, CFA, CFP
Fleurus Investment Advisory, LLC
www.fleurus-ia.com
(203) 919-4980