
Overview
The S&P 500 lost .76% in July. The Nasdaq Composite shed 3.19%, while the Russell 2000 (small cap index) declined 3.03%. The losses were attributable to a variety of factors including a correction in the Chip-making sector as well as a communication from the new Fed Chair (Kevin Warsh) that confused investors following the first FOMC (Federal Open Market Committee) meeting under his leadership.
Internationally, the market reaction to these developments was more muted. The EPAC BM Index (International developed economies) rose .22% while the MSCI EM (emerging markets) lost 3.03%.
The chart below illustrates the severity of the correction in the microchip production sector since June and until recently:
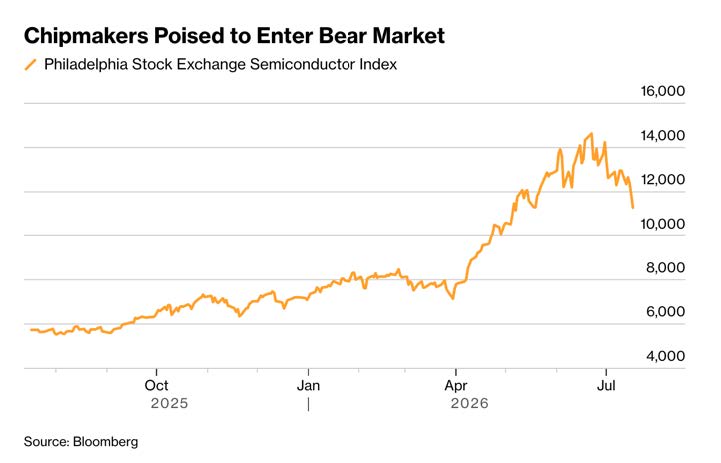
The correction in this sector weighed heavily on the rest of the equity markets in July. As of this writing though, the microchip sector has recouped about fifty percent of its losses since early June. A more serious correction and a possible contagion to the rest of the market has been avoided, for now, due to surprisingly good corporate earnings.
In July, US fixed income markets dropped. The US bond aggregate lost 1.30%. Investment grade corporate bonds declined 1.67%, while high yield corporates returned a negative .25% and the long bond dropped a more painful 4.00%.
Our median portfolio was down .52% in July. Over the same period, a portfolio consisting of 50% ACWI (All Country World Index) and 50% AGG (US Bond Aggregate) declined .92%. Overall, our median portfolio is up 4.90% YTD (Year-To-Date) vs. 5.36% for our benchmark.
Market developments
The conflict with Iran and the contradictory messages associated with it contributed to the volatile and mostly negative tone of the market in July. Additionally, high valuations in the Chip sector were called into question, causing a painful correction in that sector. Finally, a somewhat confusing messaging from the Fed Chair added to the overall uncertainty causing the yield curve to steepen.
Short-term interest rates dropped a bit after his post-FOMC speech, while long-term rates went up, as illustrated in the chart below:
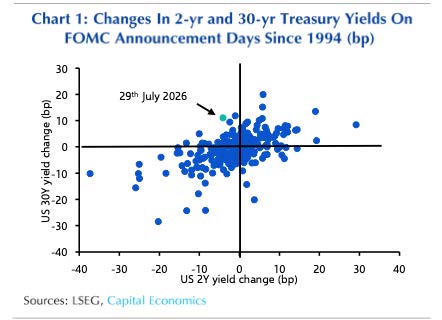
What the chart says is that, after the FOMC announcement, the yield on the two-year note went down about .05% while the yield on the thirty-year bond went up .10%, causing the government bond yield curve to steepen by .15%. The green dot on the chart illustrates this.
The reason for this development is that the message from the FED led market participants to think that the probability of a rate hike in September was lessened, hence the slight drop in the yield of the two-year note, and that the FED’s commitment to fighting inflation was possibly less than what was expected until then, causing the yield on the long bond to rise.
This is a development worth keeping an eye on. The bond market tends to send signals that equity investors ignore at their peril.
Portfolio Commentary
Our slight out-performance in July is the result of our relatively low exposure to the high growth sector of the market. High valuations there were called into questions in July.
However, this seems to have been a temporary development since, as of this writing, the main indices have bounced back up. The main reason behind the bounce: superb second quarter earnings.
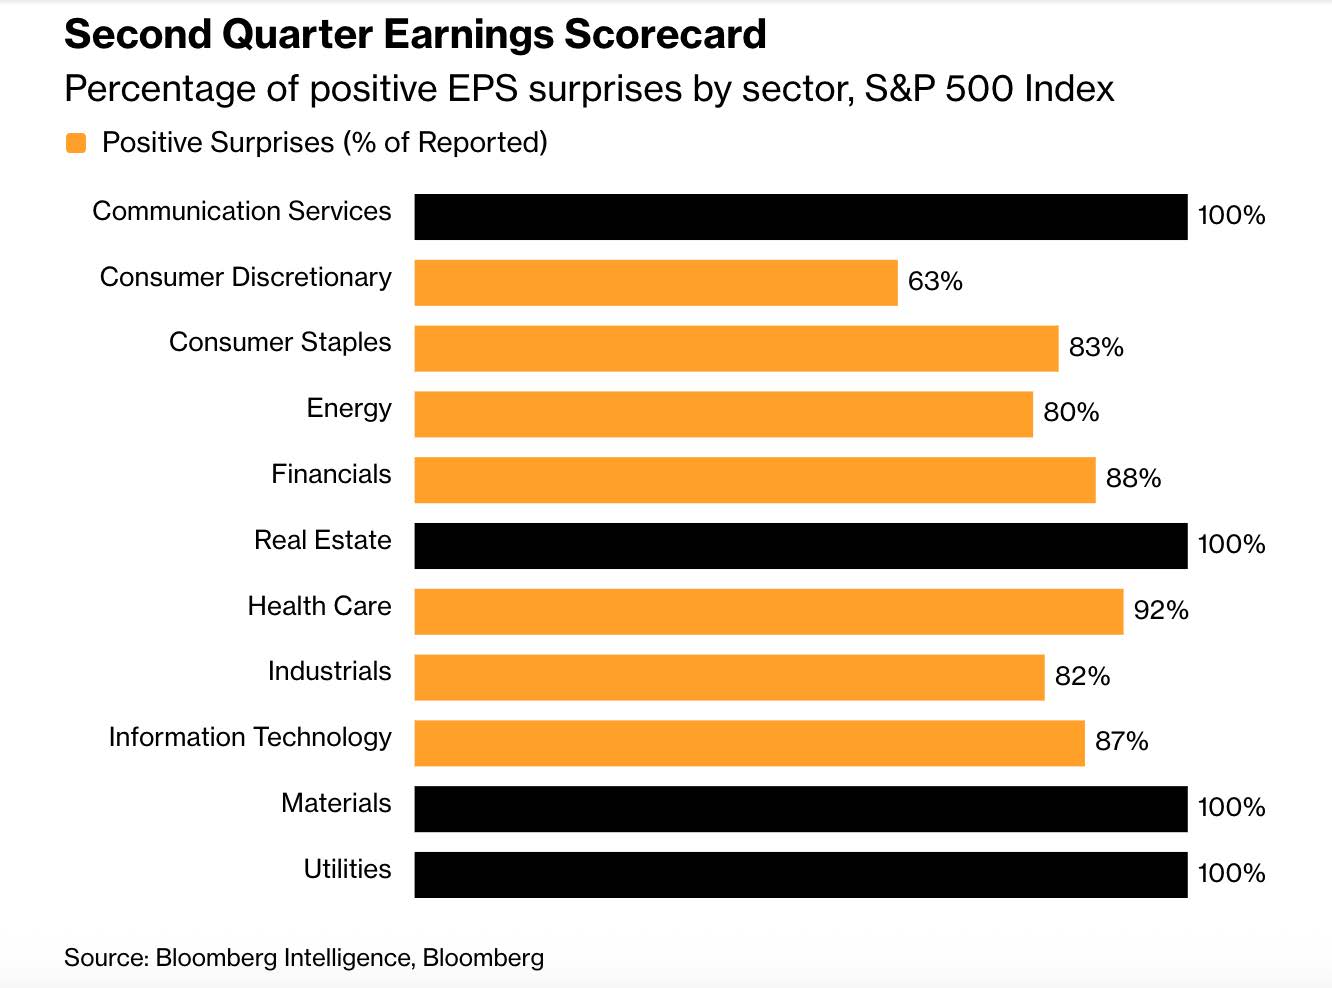
Specifically, as of today, of the 307 corporations that are part of the S&P 500 and that have reported, 85% have beaten analysts’ expectations regarding earnings and 67% of them have beaten revenue expectations. As long
as this positive and strong trend remains, a severe market correction in unlikely. We may see sectorial corrections, but a broader drawdown is improbable.
The chart below illustrates how various sectors of the S&Ps’500 have fared, so far, in the current earnings season:
In this relatively good environment, I have kept most portfolios unchanged. We remain slightly under allocated to the most highly priced sectors of the equity markets. I do not see a good reason to change that posture.
With respect to the fixed income part of our portfolios, I may reduce their duration going forward, should the muddled messaging from the FED continue.
Conclusion
Looking at the US economy more broadly, the latest GDP data tend to indicate a relative softening while inflation remains robust and higher than the FED’s target of 2%.
Overall employment is stable enough and, as a result, the FED could decide to concentrate on the inflation component of its dual mandate (the other component of that mandate being to strive to support employment). It has room to do so.
Whether they do so and, in the process, reassure investors of their unequivocal independence from the White House, remains to be seen.
Thank you for your continued trust.
Jeff de Valdivia, CFA, CFP
Fleurus Investment Advisory, LLC
www.fleurus-ia.com
(203) 919-4980