Overview
US equity markets marked time in December.
The S&P 500 added .06%. The Nasdaq 100 lost .47%. The Russell 2000 (small cap index) was down .58%.
Internationally, the EPAC BM Index of developed economies (ex-US) rose a robust 3.22%. The MSCI EM (emerging markets) increased 2.74%. while the MSCI Frontier 100 index added 4.58%.
A widely expected reduction of .25% in the Federal Funds Rate caused a muted reaction for US equities. However, it contributed to a drop in the value of the US against major other currencies, adding fuel to international equities.
This concluded a volatile but quite positive year for US equities, as illustrated below:
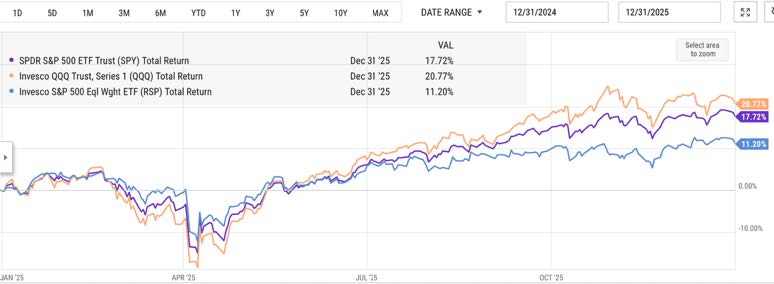
The most interesting part of the chart above, is the sharp dichotomy between the performance of the S&P 500 (purple line-17.72%) and that of its equal-weighted counterpart (blue line-11.29%). What it says is that if you had invested in the S&P 500 index you would have made 17.72% in 2025 but that if you had invested EQUALLY in its 500 components, your performance would have only been 11.29%. This wide gap in performance is the result of the extreme weight of large stocks in the value of the S&P 500. At the end of 2025, the ten largest capitalization stock in that index accounted for about 40% of the valuation of the index and about as much of its performance.
In December, US fixed-income markets declined a bit, with the exception of the high-yield sector. The US bond aggregate was down .15%. Investment grade corporate bonds lost .20% while high yield corporates progressed .57%.
Our median portfolio was up .28% in December. Over the same period, a portfolio consisting of 50% ACWI (All Country World Index) and 50% AGG (US Bond Aggregate) rose .31%. Overall, in 2025, our median portfolio was up 9.27% vs. 14.80% for our benchmark.
Market developments
It was hard not to make money in 2025. All major markets went up. International equities did very well. thanks in part to a decline of the USD of close to 10% against major currencies. US equities went up nicely too, as illustrated in the previous chart.
What was very hard however, was to stay fully invested as the Trump Administration engaged in highly disruptive economics and geopolitics. The level of market volatility that ensued is best illustrated by the performance of the Nasdaq over the first four months of the year, as shown below:
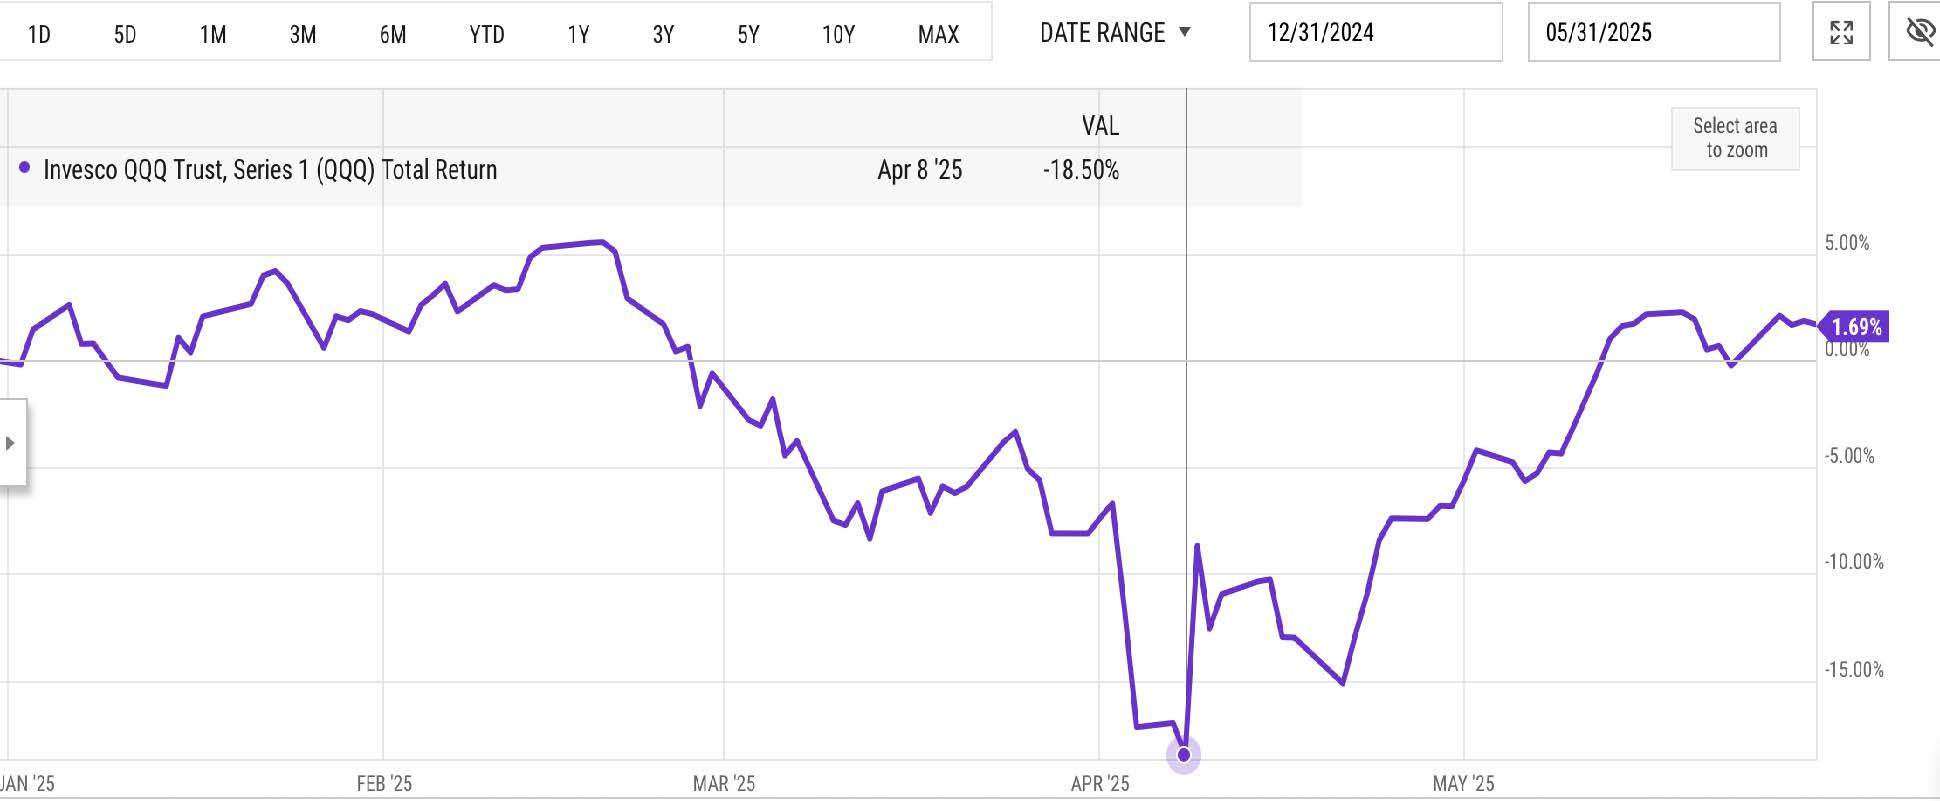
On April 8, the Nasdaq (QQQ in our chart) was down 18.50% for the year. At the end of May, it was basically flat. At the end of the year, it was up 21.14%. The tariffs announcements brought that index to its nadir. Their partial reversal caused the rebound from mid-April to the end of May. Then, the Artificial Intelligence (AI) investment boom propelled the market higher throughout the rest of the year. All told, the magnitude of the swing, from nadir to end of year: a whopping 40%!
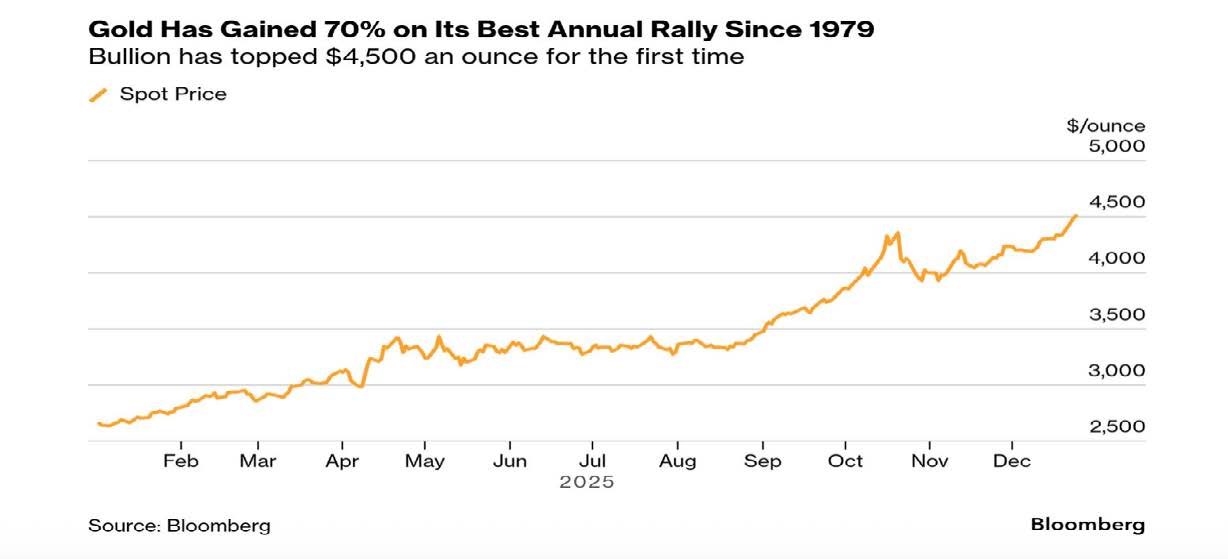
Adding to the tariff-related volatility caused by the Trump Administration policies, came the upending of the Western Alliance. That policy, or lack thereof, contributed in no small part to the historic rise of gold in 2025, as illustrated below:
Portfolio Commentary
As I reflect on 2025, I am happy that we had a few good calls and that we were, overall, able to capitalize on the equity uptrends. However, I missed part of the AI-driven equity rebound that brought most indices to new highs.
I was, in part, the victim of my tendency to remain skeptical of high stock valuations and of sectorial concentrations; This led me, early in the year (ahead of the tariff mess), to divest of tech stocks in favor of value and equal-weighted equity indices. While the call was a good one for about three months, the decision by most investors to favor large capitalization tech stocks over everything else, starting in mid-April, caused us to underperform our benchmark over the rest of the year.
The chart below illustrates the sectorial concentration in the S&P 500, that I remain dubious about. The information is as of 10/22/2025. It has not changed much since:
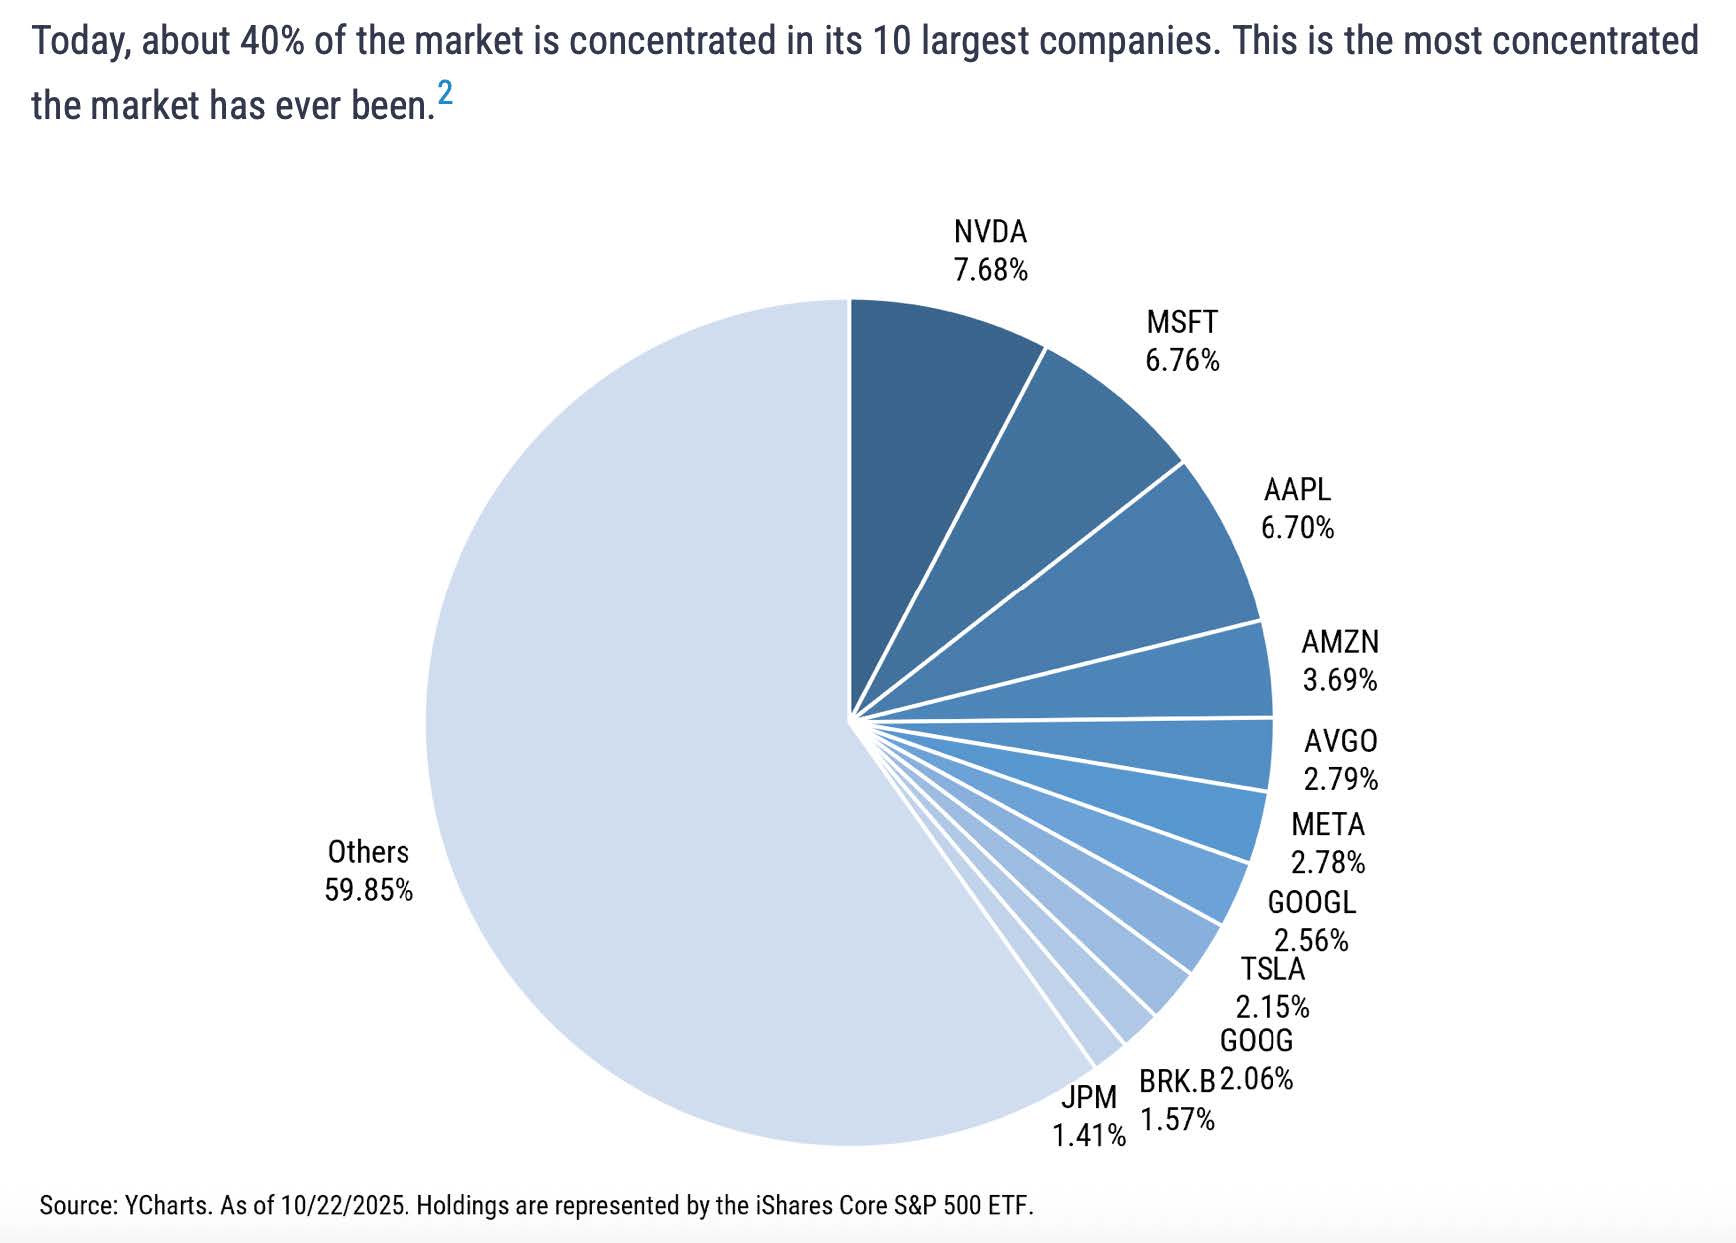
Except for JP Morgan and Berkshire Hathaway, all other major components of the S&P 500 are mega tech stocks. So much so that, for some analysts, the S&P 500 is no longer representative of the US equity market at large. In order to match the performance of the S&P 500, a manager MUST abide by this level of concentration. I tend to view it as a major risk and have eschewed this approach in 2025. It has cost us a few percentage points of performance.
I view my job as that of a steward of my clients’ financial assets. As such, I manage risk as well as performance and need to recognize risks when they materialize and adjust portfolios accordingly. On occasion, that will cause me to be early and to underperform.
Conclusion
The AI investment boom that was behind much of the US equity indices’ performance in 2025 may be losing steam, as I write this newsletter. Or not… I have seen signs of both over the past two months.
As far as markets are concerned, 2026 will bring its batch of surprises, good and not-so-good. We will just have to manage that uncertainty to the best of our abilities.
I wish you a year over-abundant with good health and peace of mind.
Thank you for your continued trust.
Jeff de Valdivia, CFA, CFP
Fleurus Investment Advisory, LLC
www.fleurus-ia.com
(203) 919-4980